How to run a chaos experiment on a service using Gremlin

.svg)
.svg)

Introduction
Running chaos experiments on individual hosts, containers, and Kubernetes clusters is easy, but running experiments on distributed applications and services is typically much harder. Not only do you need to know which systems your services are running on, but how to manage your blast radius to avoid impacting other services.
With Services Discovery, Gremlin automatically detects services running in your environment and lets you select them as targets for chaos experiments. Not only can you run experiments on services, but you can also view each service’s configuration details, track your experiment history for each service, and link to monitoring dashboards and incident management runbooks, all from within the Gremlin web app.
In this tutorial, we’ll show you how to run an attack on a service through the Gremlin web app. We’ll demonstrate this by using a microservice-based e-commerce application running on a Kubernetes cluster.
Overview
This tutorial will show you how to:
- Step 1: View and edit a service in the Gremlin web app.
- Step 2: Run a latency attack on the service.
- Step 3: Record the results of the experiment in Gremlin.
Prerequisites
Before starting this tutorial, you’ll need:
- A Gremlin account (request a free trial)
- An application running on a host (this tutorial uses a Kubernetes cluster running the Online Boutique demo application).
- The Gremlin agent running on your systems with the Services Discovery feature enabled. To install Gremlin, follow our quick-start guide or read our documentation on installing Gremlin. You can also use the Gremlin Playground to quickly create a virtual machine instance with Gremlin pre-installed. To enable Services Discovery, read our documentation.
- (Optional) A monitoring service such as Datadog or New Relic.
Step 1: View and edit a service in the Gremlin web app
First, we’ll identify a service that we want to run a chaos experiment on. We chose currencyservice, which provides currency conversion functionality to other services in the application. Because currency conversion is integral to other services, any availability or performance problems with this service can have a major impact on the entire site. We’ll use Gremlin to inject failure into this service, observe the impact on our application, and use our observations to consider how we can improve our resilience.
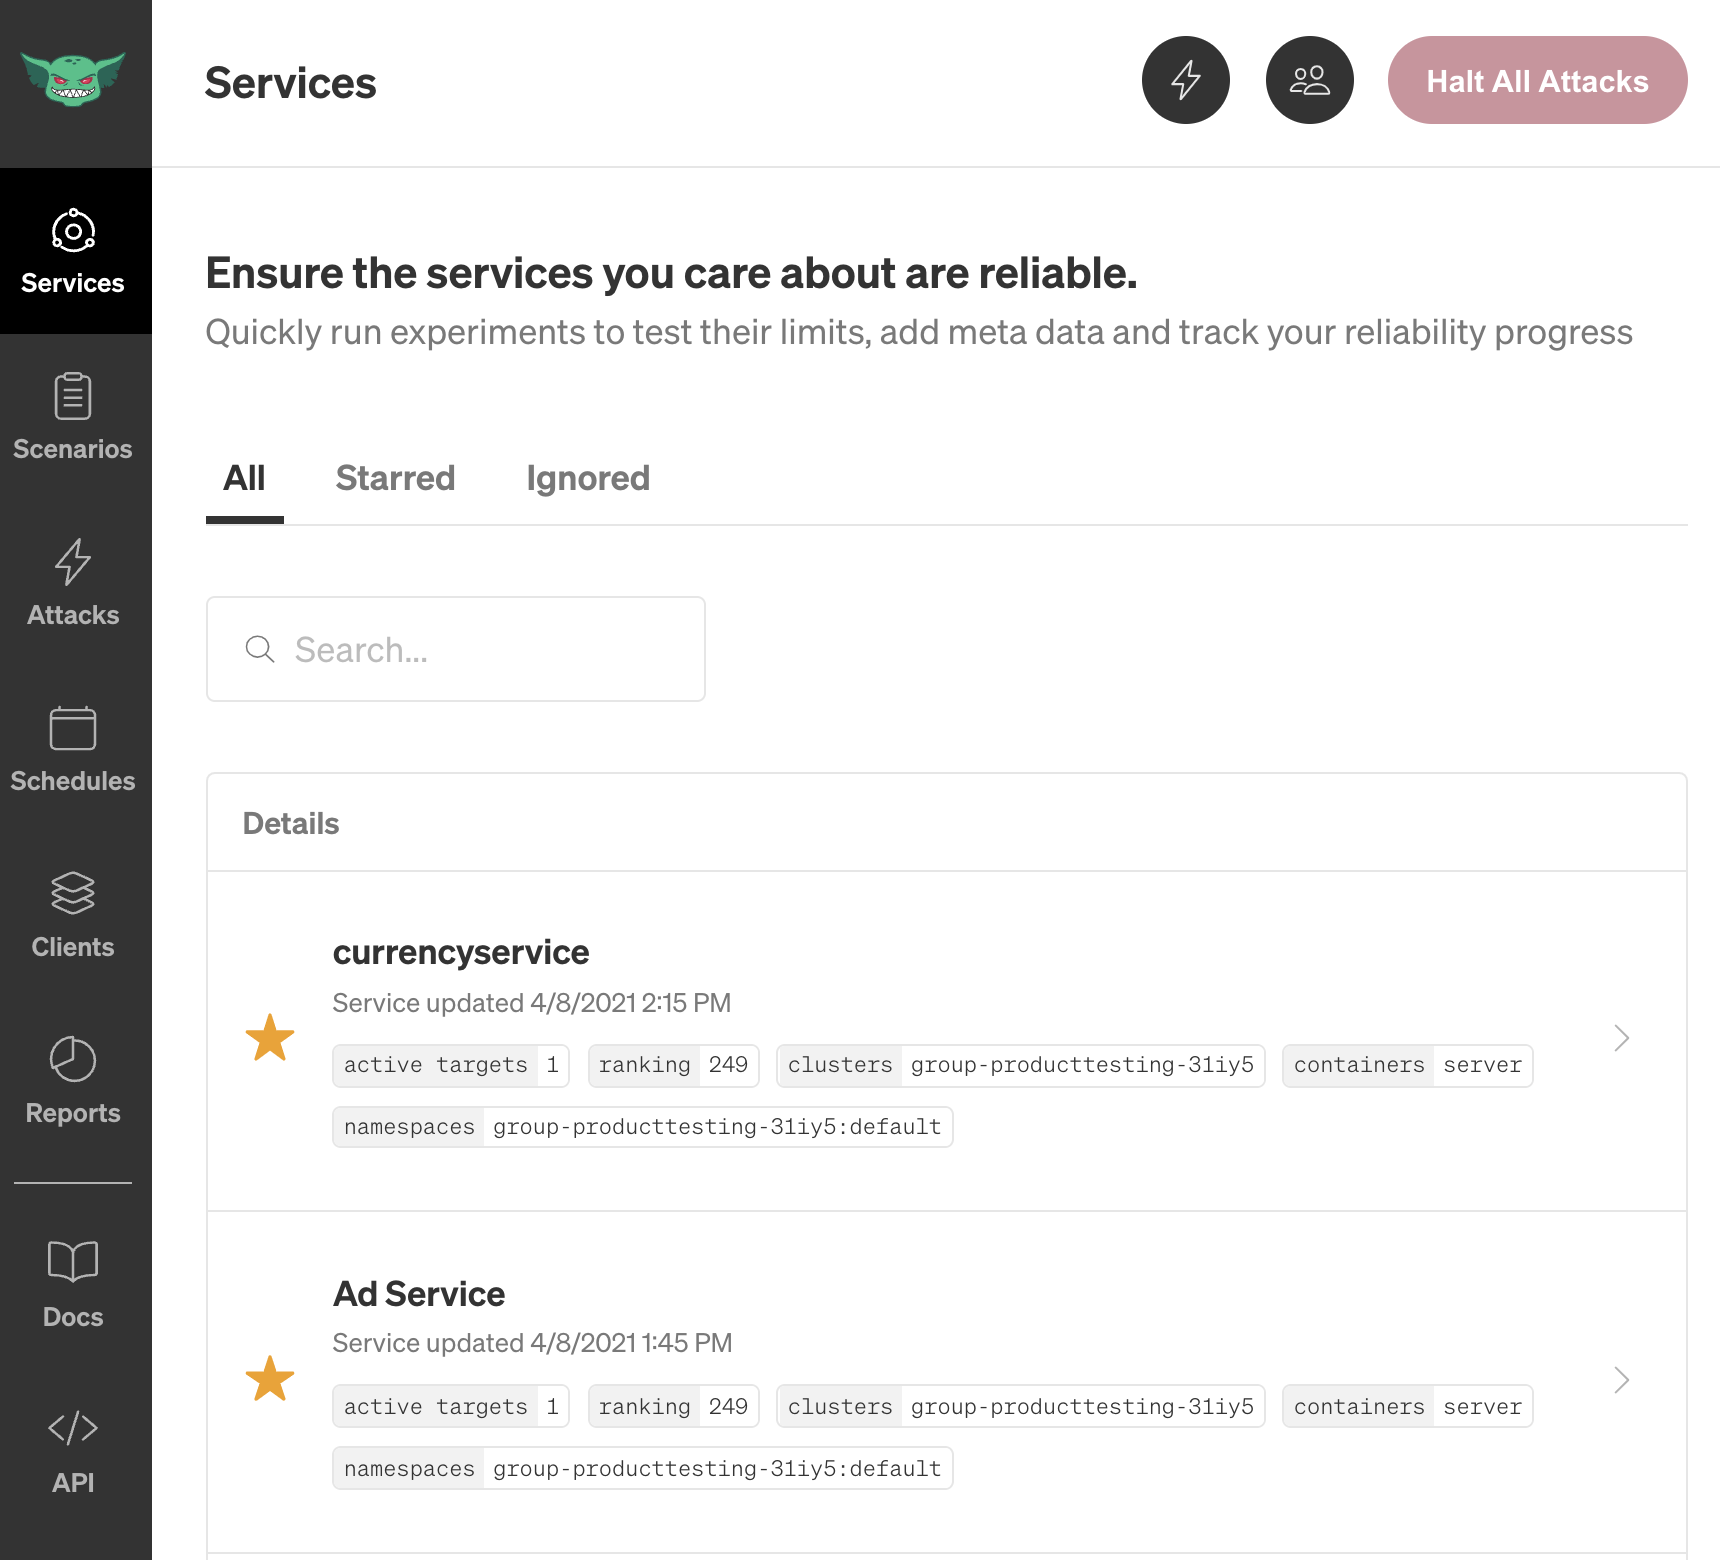
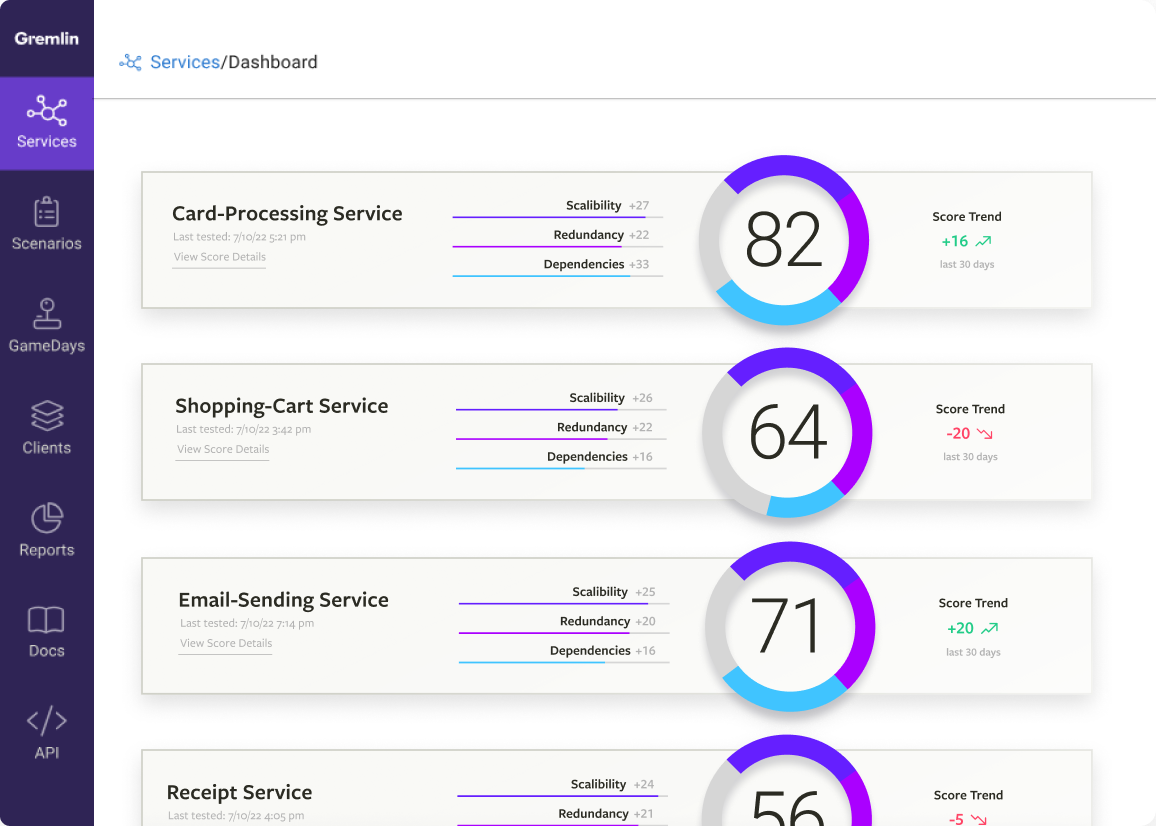
First, log into the Gremlin web app and select the Services icon in the left-hand navigation bar. This shows a list of all of the services that Gremlin detected in your environment. Since currencyservice is an important service that we want to test frequently, we’ve starred it so that it appears at the top of our list:
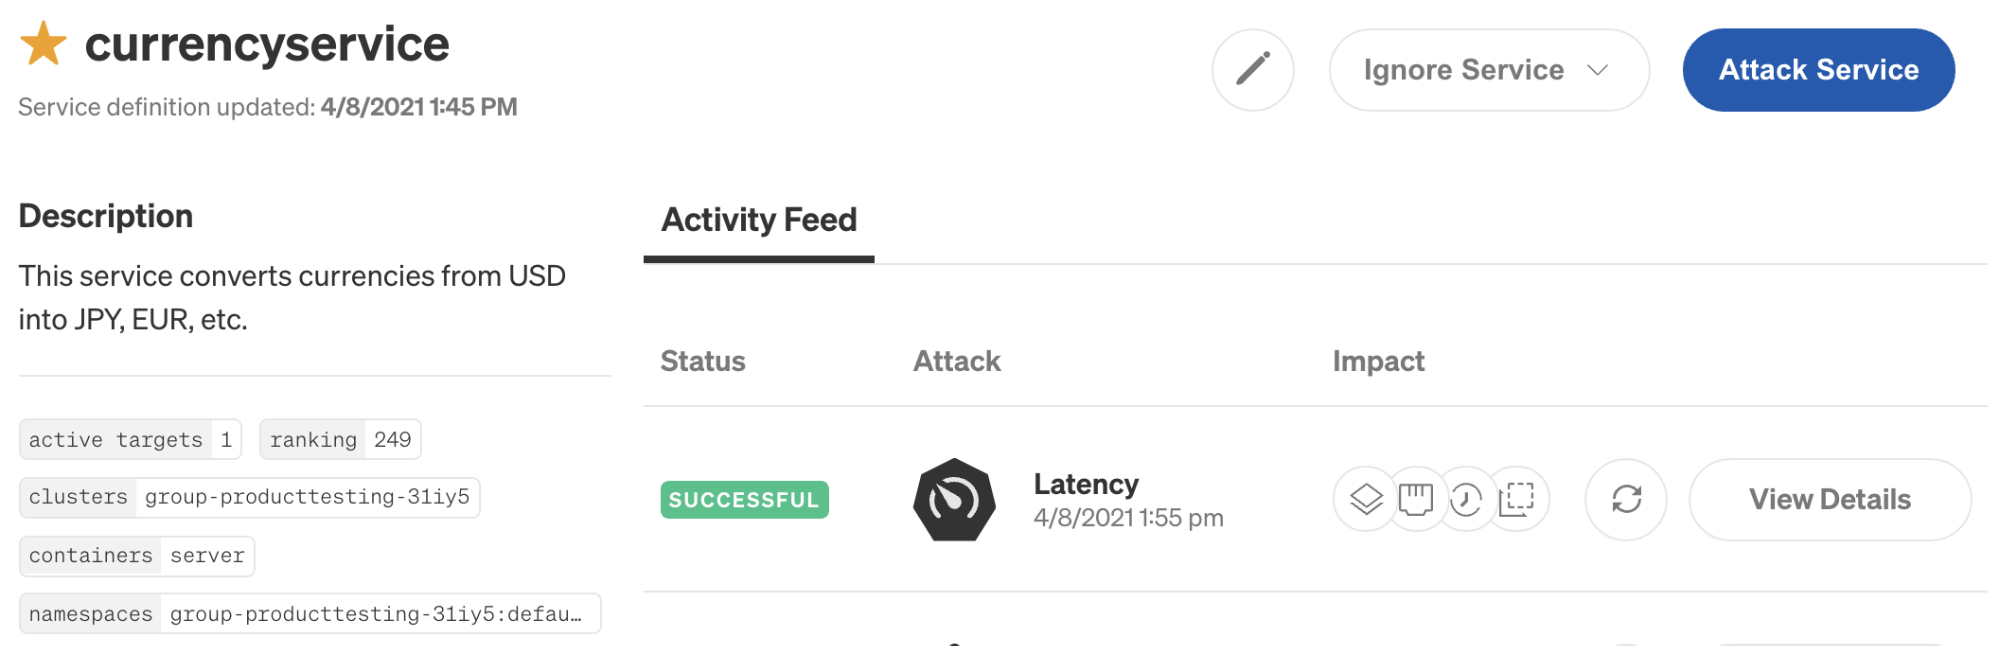
Next, click on currencyservice to open the Service Details screen. This shows the service’s automatically detected configuration details, when it was last updated, and an Activity Feed listing recent attacks. You can also add a description, link to the service’s monitoring dashboards, link to the service’s incident management runbook, and assign an owner.

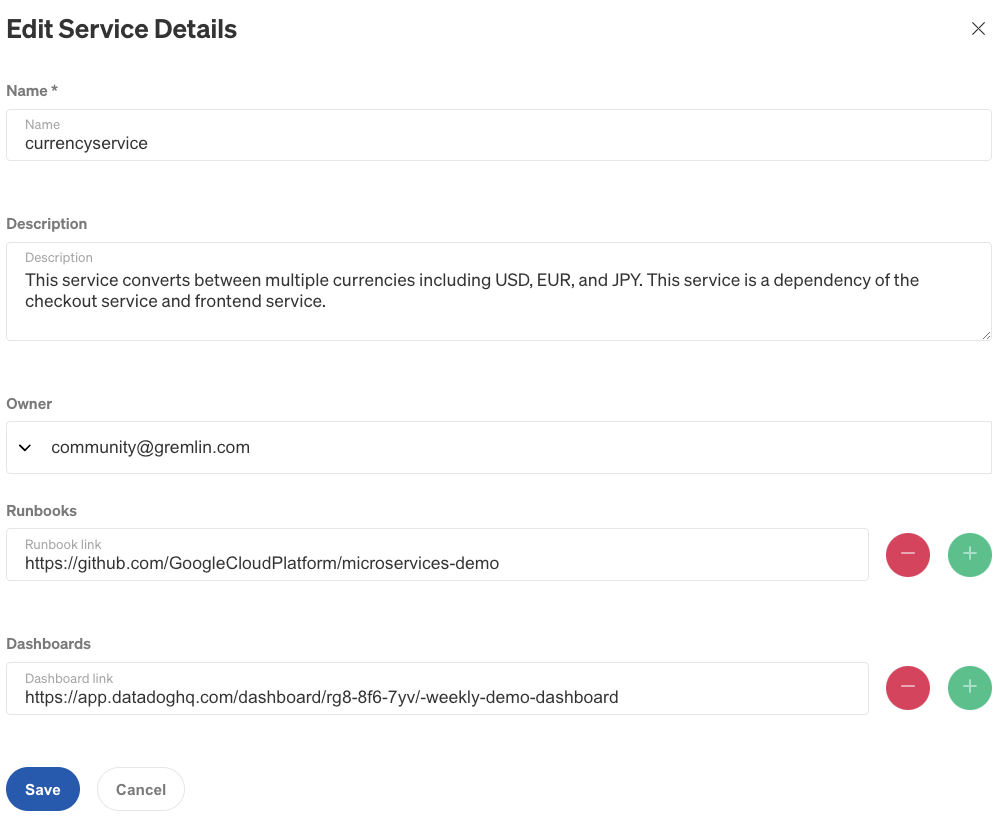
To edit the service, click the pencil icon in the top-right corner of the page. You can enter a description, select an owner from the list of Gremlin users in your team, and add links to dashboards and runbooks. Note that you can add or remove multiple dashboard or runbook links by using the + and - icons. Click Save to apply your changes.
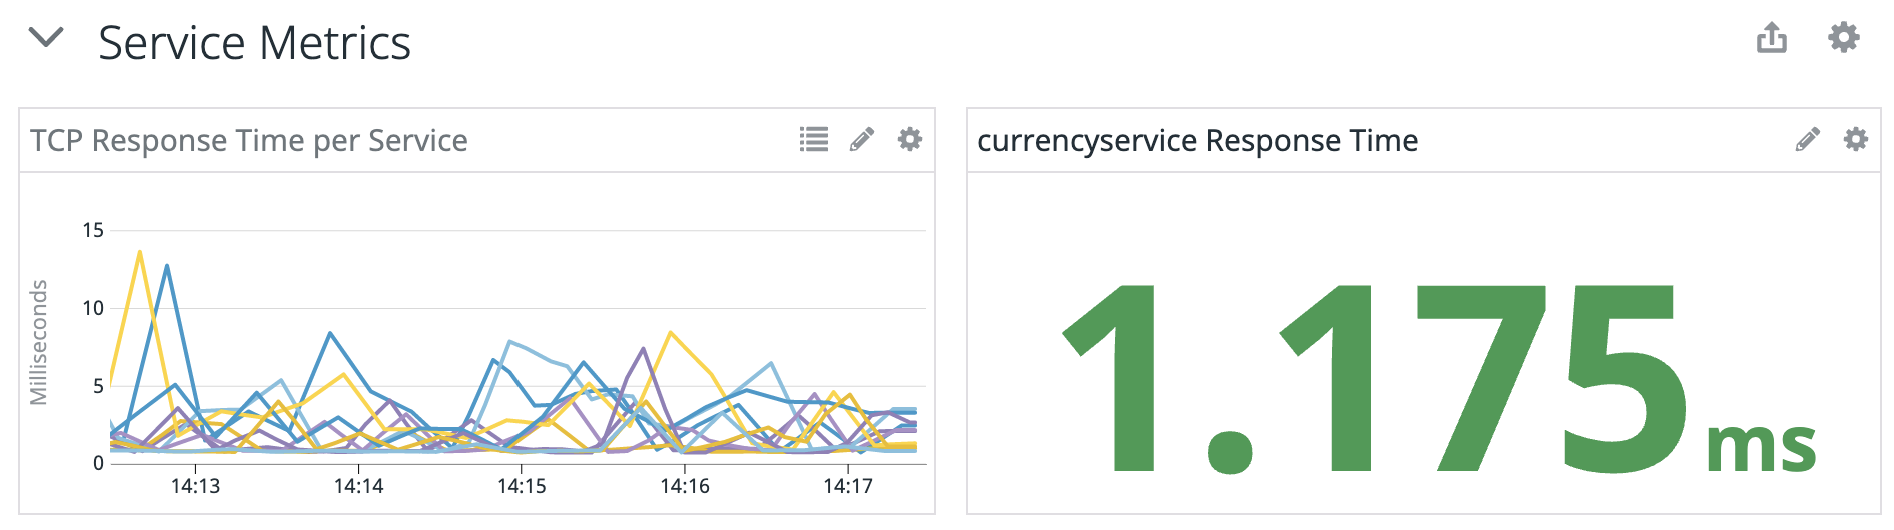
Before we run our attack, let’s identify our baseline metrics for this service. The best way to measure this is by using a monitoring tool capable of tracking latency for each service. In this example, we’re using Datadog.
Here we can see the response time averaging around 1.175ms. We’ll keep this in mind when we run our attack later:
Step 2: Run a latency attack on the service
Our chaos experiment will test how our application responds when the currencyservice is experiencing increased latency. Other services interact with this one using gRPC calls, so any amount of network latency can have a significant impact on overall performance. We’ll simulate a high-latency connection by running a latency attack, which adds a set amount of latency to each network packet.
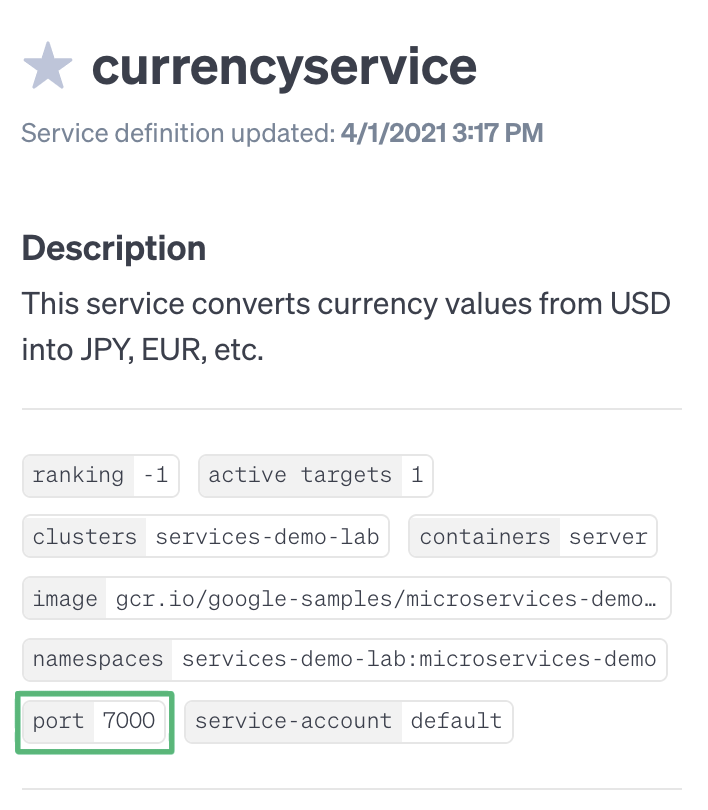
We also want to strictly control our blast radius (the systems impacted by the attack). Since this is a distributed application, simply targeting each node that the service is running on could result in a large-scale outage. To minimize the impact, we can take the specific port number that the service is listening on and use it to limit the attack. If we check the Services Detail page, we can see that Gremlin automatically detected that this service communicates over port 7000.
Note that this is a Kubernetes application, so the latency attack will be contained to the currencyservice Deployment. If this was running directly on the host, using the port number to limit the blast radius would prevent a host-wide latency attack.
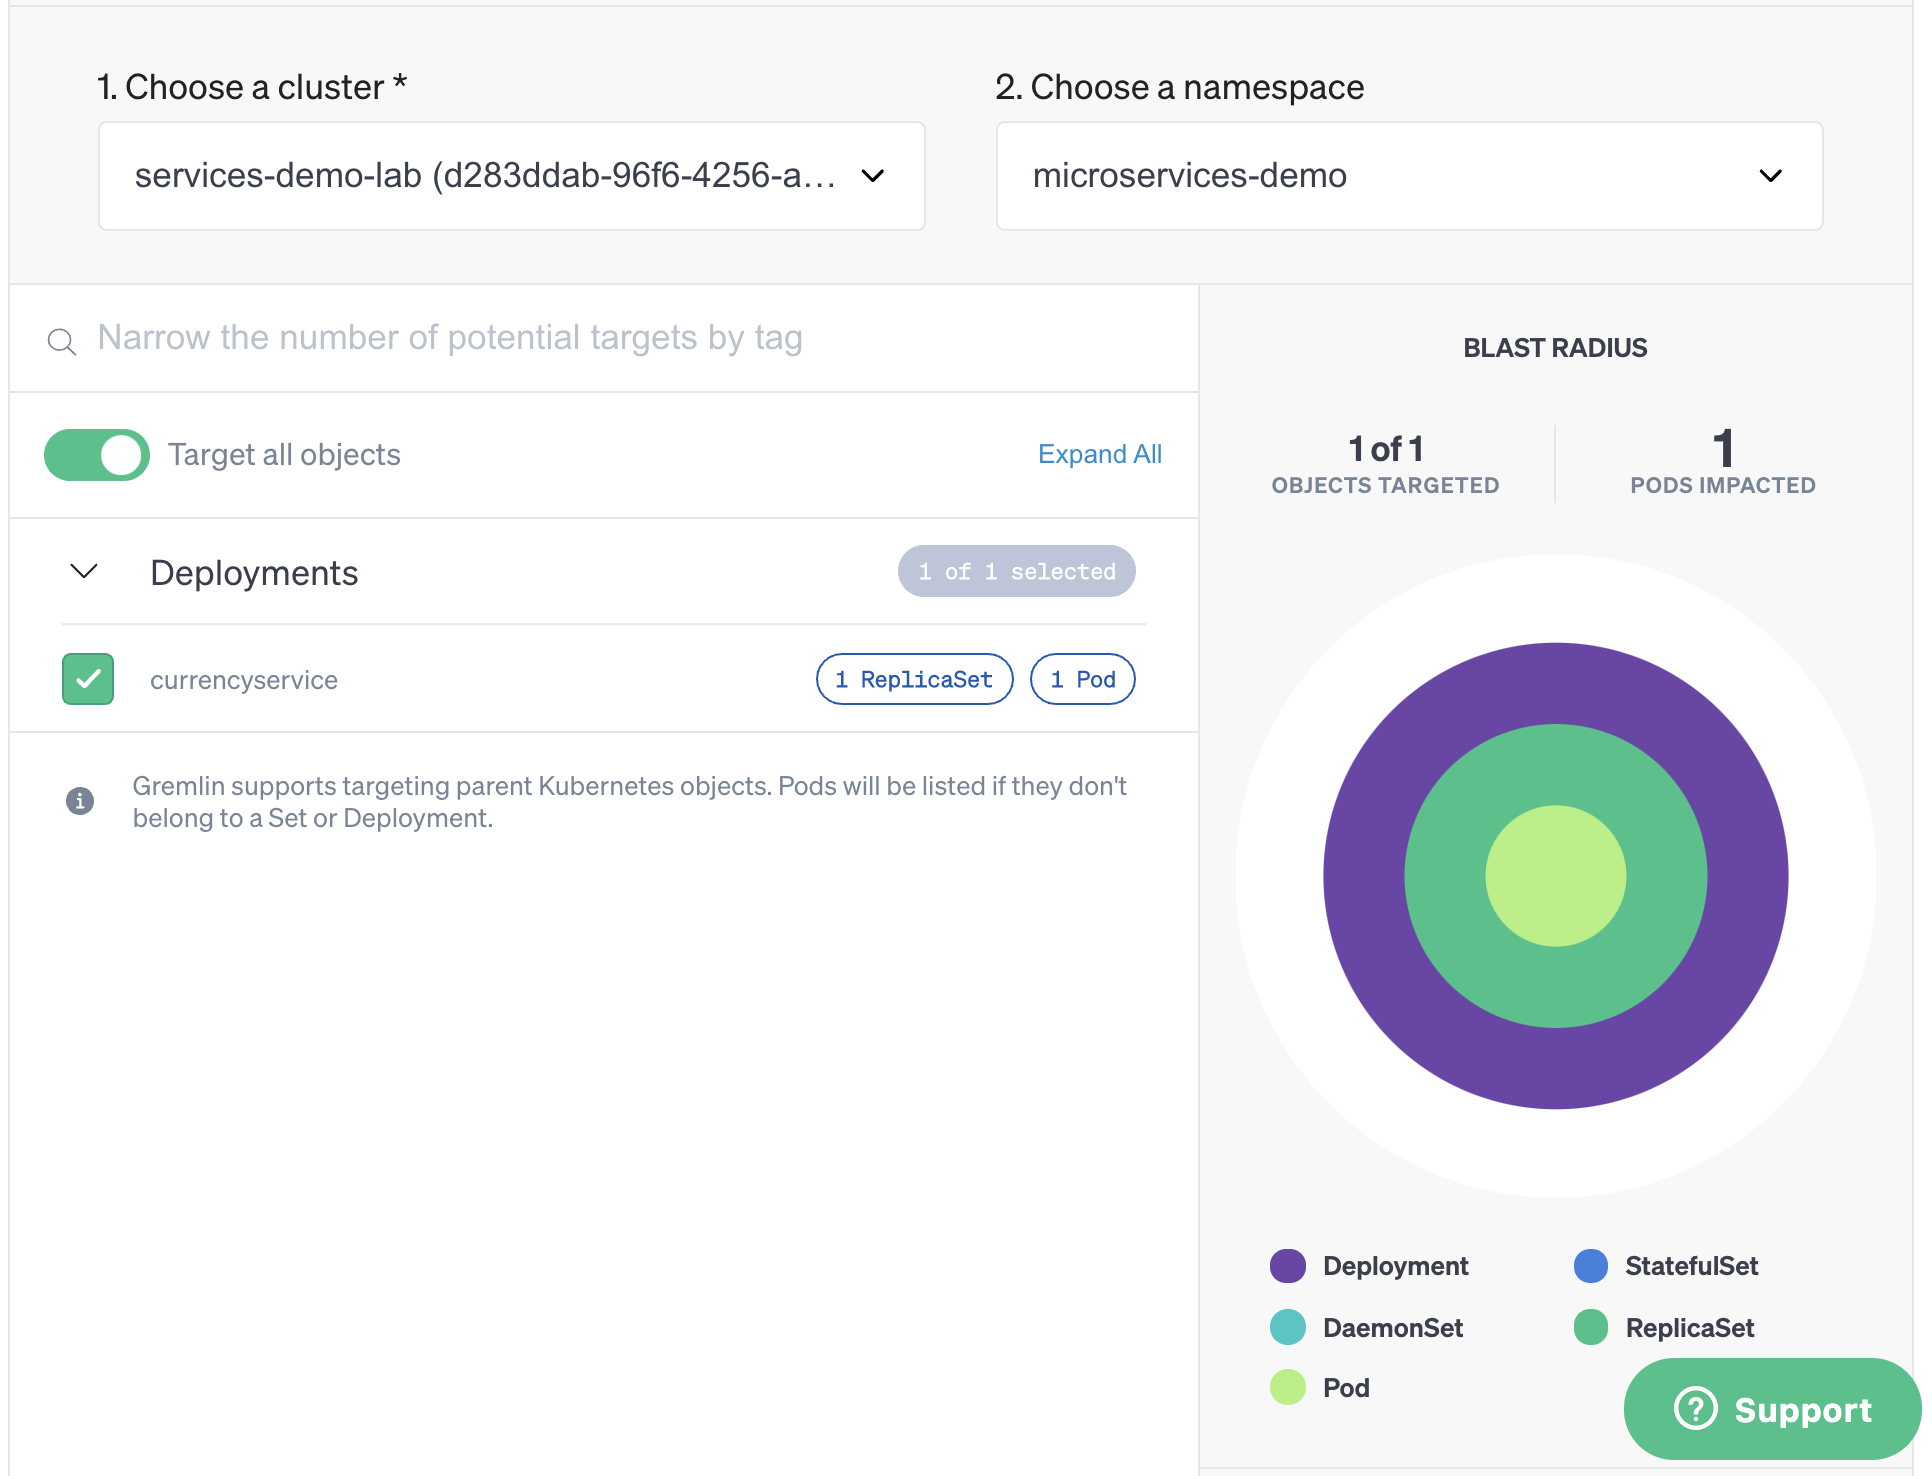
Now that we’ve defined our experiment, let’s click Attack Service to start configuring the attack. The service is already selected by default, and we can see the blast radius on the right side of the screen:
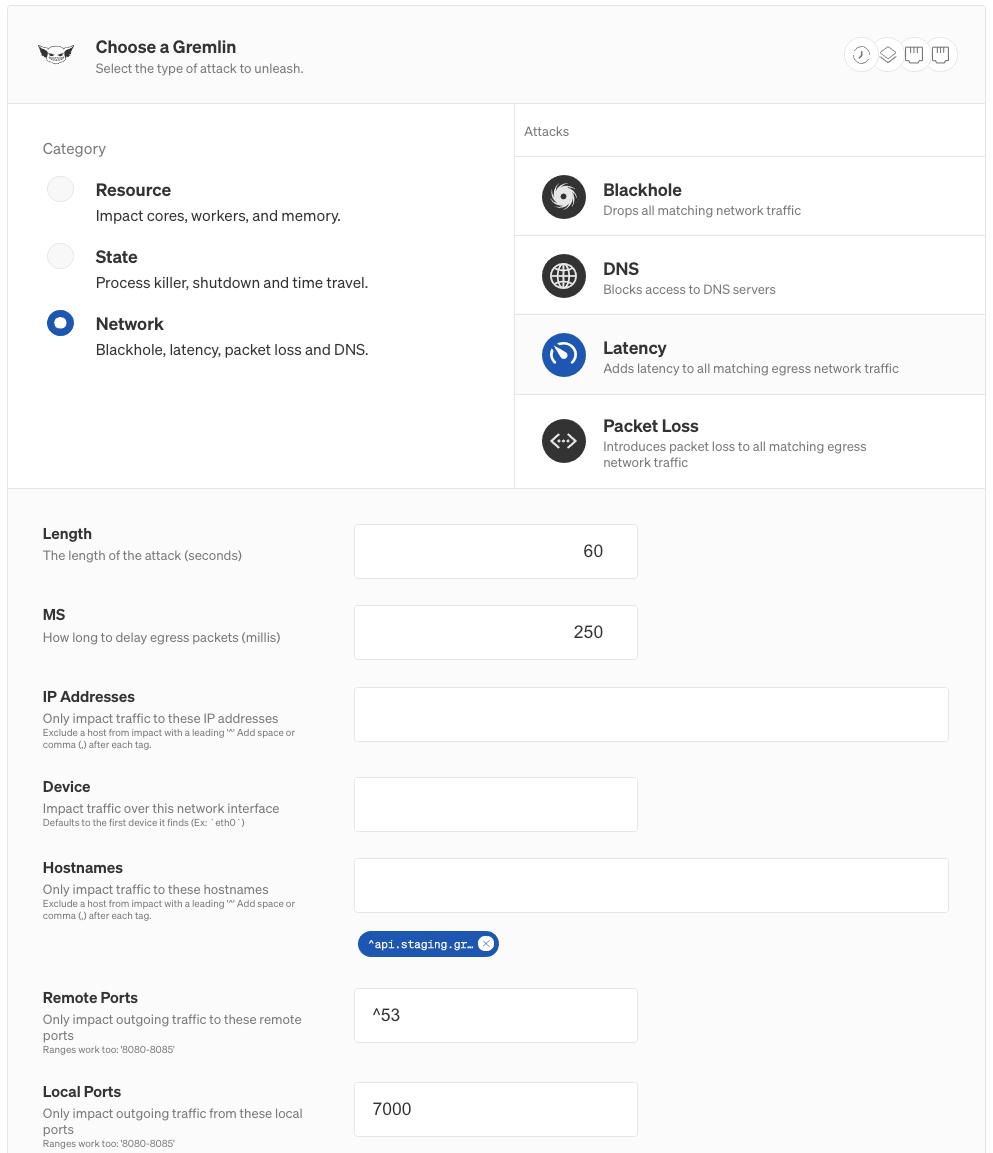
Under Choose a Gremlin, select Network, then Latency. Change the MS field to 250 to add a 250ms delay, then add 7000 to the Local Ports field. This means that the attack will only add latency to traffic over port 7000. Next, click Unleash Gremlin to start the attack.
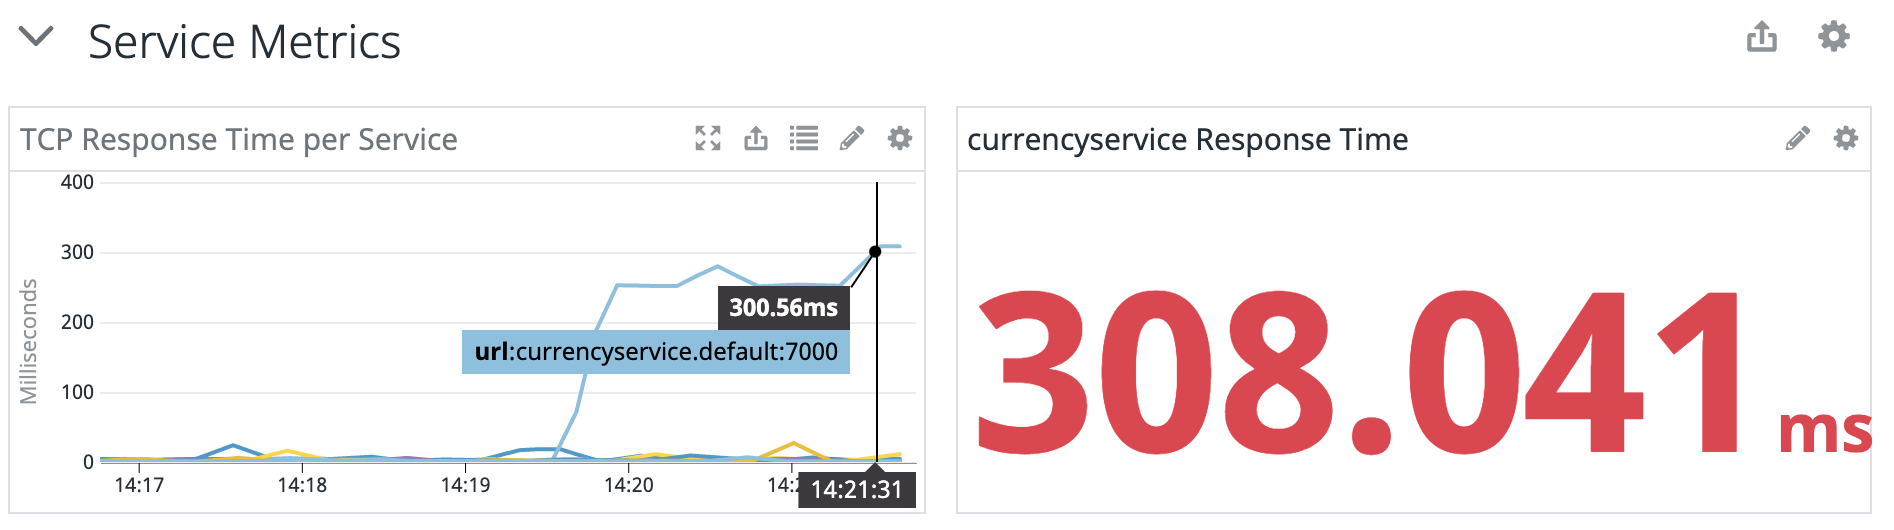
While the attack is running, try browsing the website. The site is noticeably slower, even accounting for the 250ms added by the latency attack. Everything from loading the main page to viewing a product to updating the shopping cart takes several seconds.
We can see this reflected in Datadog:
Now that we know the impact, stop the attack by clicking the Halt button in the top-right corner of the screen.
Step 3: Record the results of the experiment in Gremlin
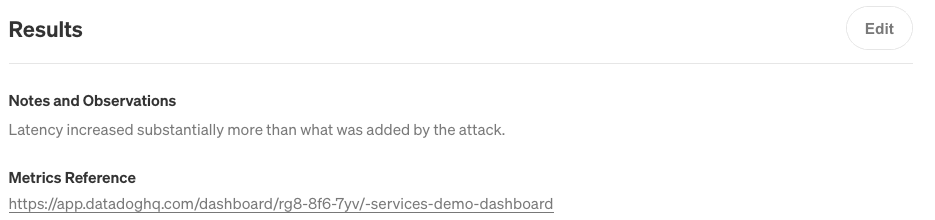
Once the attack stops, we can record these observations in the Notes and Observations and Metrics Reference fields in the Attack Details page. We’ll also add a URL to our dashboard:
Next, click on the Service Details button in the top-right corner of the screen. The Activity Feed immediately shows the new attack. The next time we want to run this attack, we can simply open this page, scroll to the latency attack, and click the re-run button under Impact. This makes it easy to see what experiments we’ve run on this server, when we last ran an experiment, and what the status was.
Conclusion
Using services in Gremlin is a great way to gain visibility into your environment, run controlled chaos experiments, and track your progress towards greater reliability. Now that you have a service with runbooks, dashboards, owners, and an attack history, try increasing the magnitude of your latency attack. Try running different attacks such as a blackhole, packet loss, or resource consumption. With each attack, record your observations in the results to keep a record of your experiments. This will help you improve the resilience of your services over time.
Want to learn more about running chaos experiments on services? Watch our "Chaos Engineering in 60 seconds" guide:
Or, watch our full product walkthrough that covers everything from discovering your services to running your first attack:
Related

Avoid downtime. Use Gremlin to turn failure into resilience.
Gremlin empowers you to proactively root out failure before it causes downtime. See how you can harness chaos to build resilient systems by requesting a demo of Gremlin.GET STARTED
.svg)